
THE ELECTION looms. No doubt you are either checking the poll numbers on 538.com and the mini-scandals on Politico on an hourly basis, or you’re studiously avoiding the whole sordid affair (a phrase that seems to describe this year’s election especially well). In any case, by the time you read this, the numbers will have changed and so will the scandals, so let me focus instead on the past: on recent elections, specifically on what we know about the GLB electorate and its importance in the larger scheme of things. (As I write, Donald Trump’s wife has just been accused of plagiarizing her speech at the Republican Convention. Will anyone remember this in two months’ time?)
To begin with a clarification, since you may already be wondering about that “GLB” usage above. That’s the formulation used in exit polls* going back to the election of 1992, when the question was first presented to voters, along with many others, as they left their polling places on election day. The question is asked in the starkest of terms: “Are you gay, lesbian, or bisexual?” And the options offered are equally unequivocal: either “Yes” or “No.” Whatever the limitations of this approach—and clearly the inclusion of “bisexual” and the exclusion of “transgender” has implications both statistical and political—it does give a rough idea of the clout of this sexual minority as an electoral force. What’s more, it can help us to answer what has been, and to some extent still is, a critical question and a source of heated debate going back to the work of Alfred Kinsey: Just how many gay people are there in the world, anyway?
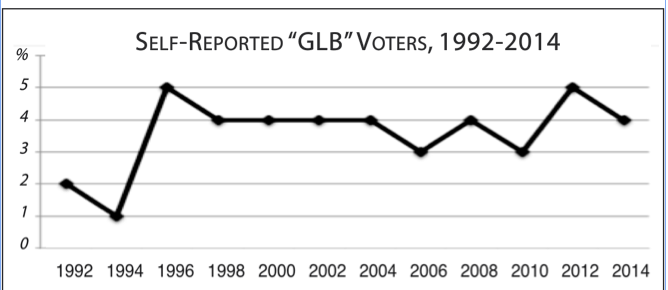
The answer provided by U.S. exit polls is fairly clear and consistent: it’s around four percent. If we ignore the first two years (1992 and 1994) as early outliers, the range has been between three and five percent since 1996. That in itself seems significant—perhaps the most important finding of these polls, because it puts to rest the religious Right’s insistence that the number of GLBT people in the U.S. is vanishingly small, perhaps only one percent. On the other hand, the four percent figure doesn’t come close to Kinsey’s famous “ten percent” estimate in 1948’s Sexual Behavior in the Human Male. Here it’s important to recognize that Kinsey asked his subjects about their sexual behavior and not their identity—our words for “gay” and “lesbian” scarcely existed back then—while the exit poll asks people to identify themselves with an explicit label.
Kinsey’s interviews, moreover, were carried out in private after trust had been established with the interviewer, while an exit poll is conducted in a public setting and administered by a casual stranger. For this reason, it almost seems surprising that fully four percent of U.S. voters would be willing to come out as gay. Surely there must be a residual element of closetedness, a reluctance to share this highly personal information, still exerting itself over some proportion of respondents. Thus the four percent figure should probably be viewed as a floor, an undercount of the “true” population of GLB voters—but by how much we shall never know.
The use of exit polls to extrapolate the total gay population assumes, of course, that GLB voters turn out at roughly the same rate as other voters. It seems a reasonable assumption, if only because there’s no reason to suppose that GLB voters would depart appreciably from non-gay voters. The best predictor of voter turnout historically has been a voting bloc’s socioeconomic status or SES—the higher it is, the higher the turnout—and many studies have shown that GLBT people’s SES tracks closely with that of Americans as a whole. In fact, some research on this question has shown that GLB participation on election day varies only marginally from that of other voters.†
The fluctuation in the number of GLB voters from year to year may be slight, but a bit of a pattern emerges. For the past several election cycles, going back to the presidential election of 2004, the GLB slice of the electorate has dipped by one point in off-year elections. What this suggests is that, for whatever reason, gay voters are less motivated to vote in non-presidential years. It’s a pattern that has been observed in other minorities, especially African-Americans and Hispanics, and it partly explains why Democrats tend to do better in presidential years than in off years. It seems that the commitment to voting is relatively “soft” for these minorities relative to white voters, a fact that has huge implications for electoral outcomes. Just why GLB voters tend to fall into this “low commitment” category is a question that may warrant additional research.

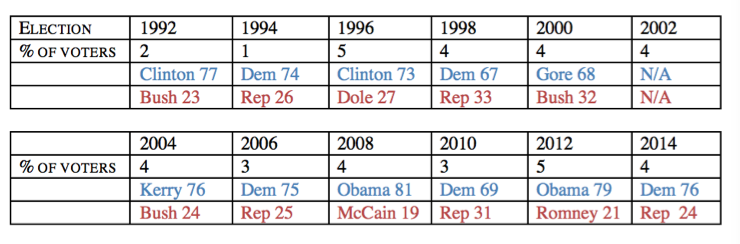
SO, HOW HAS THE GLB MINORITY voted over the years? As a reader of this magazine, you may not be astonished to learn that the GLB electorate leans heavily toward Democratic candidates, though you may be struck by the magnitude of this preference. Moreover, this lopsided pattern has been remarkably consistent all the way back to the election of 1992, running at around 75 percent Democratic within a range of 67 to 81 percent. While it doesn’t quite match the extent of African-American voters’ preference for Democrats (93 percent voted for Obama in 2012), it exceeds the historical preference of Hispanic voters, which has risen from 61 percent in 1992 (for Bill Clinton) to 71 percent for Obama in 2012.
The fact that GLB voters favor Democrats over Republicans by a ratio of three to one suggests that they form a cohesive voting bloc comparable to that of African-Americans or Hispanics (who comprised twelve and nine percent of the electorate, respectively, in 2012). By the way, two other minorities that exit polls track, Jews and Asians, also skew heavily for Democrats, coming in at 69 percent and 71 percent, respectively, in the last presidential election, closely matching the GLB numbers.
The similarity in party preference for all five minorities, as disparate as they are in so many respects, is quite striking indeed. Clearly, socioeconomic factors have a lot to do with the preference for Democrats, at least for African-Americans and Hispanics, but this cannot explain the pattern for Jewish and Asian voters, both of whom have higher median incomes than Americans as a whole. Many Asians and Hispanics are relatively recent immigrants to the U.S., while African-Americans and Jews are not. GLB people are not an ethnic or religious minority at all, and they’re literally all over the map geographically, not to mention socioeconomically and culturally. It would seem that just being a member of a minority is itself enough to nudge many voters toward Democratic candidates.
How important is the GLB voting bloc in the larger scheme of things? At four percent, the GLB share of the electorate is clearly smaller than that of African-Americans or Hispanics (of course, there is also some dual membership in these groups), but it’s on a par with Asians and double that of Jews. All five minorities tend to be clustered in urban areas, which is the main reason why cities tend to be much more Democratic than suburbs and small towns. In any case, at five percent in 2012, the GLB vote did make a difference in the outcome of the election. Five percent of the electorate in 2012 equals almost 6.3 million voters. That means (using the figure of 79% versus 21%) that the GLB electorate contributed about 3.7 million votes to Obama’s margin of victory over Mitt Romney. (Obama’s total margin was around five million votes.)
A detailed analysis of the 2012 election by the Williams Institute in L.A. showed that the GLB vote was in fact decisive for Obama’s election. Without it, two states that went for Obama—Florida and Ohio—would have gone for Romney, flipping the Electoral College tally from 285 to 253 in Obama’s favor to a Romney victory of 272 to 266. Another analysis showed that the popular vote without GLB voters would have been virtually tied at 49 percent apiece; it was the GLB vote that gave Obama his four percent margin in the popular vote.
ANOTHER MEASURE of the political influence of GLBT voters is the number of elected officials in the U.S. who are openly gay or lesbian, and this number has been climbing steadily for the past three decades. The Gay &  Lesbian Victory Fund is an organization that keeps track of the number of elected officials—in addition to helping GLBT candidates get elected—and they recently compiled the totals, including officials at the federal, state, and city levels, for four years (1991, 2006, 2009, and 2016). From the earliest out officials in the 1970s—Harvey Milk of San Francisco was not the first, contrary to popular belief (that was Elaine Noble of Cambridge, Mass.)—that number has climbed from around four dozen in 1991 to around 500 today—and the number appears to be rising steadily. For the record, the highest-ranking elected official is Tammy Baldwin, a U.S. Senator from Wisconsin. There are currently six openly gay members of the House—all of them Democrats—one each from Arizona, California, Colorado, New York, Rhode Island, and Wisconsin.
Clearly, the GLB vote is not sufficient to elect gay candidates on its own, which means that non-gay voters must be increasingly willing to elect gay candidates, which in turn means that being gay is no longer the automatic disqualifier that it once was. This willingness to elect gay candidates is reflected in polls that show steadily rising support for gay equality among rank-and-file voters. Thus, for example, support for same-sex marriage stood at 27 percent in 1996, and it had risen to 58 percent by June 2015—the month of the Supreme Court’s ruling that legalized same-sex marriage nationally—and has since gained another three points (according to the Gallup Organization). Other polls show a slow and steady rise in the proportion of Americans who support a national Employment Nondiscrimination Act (ENDA)—now a clear majority—though passage has been stalled in Congress for years. But that, as they say, is a topic for another time.
* Exit polls have been conducted by a number of organizations over the years, in all cases a consortium of news outlets that agree to pool their resources and share the results of the poll. Since 2004, the national exit poll has been conducted by the National Election Pool (NEP), a consortium of ABC, AP, CBS, FOX News, and NBC.
† See Vanessa M. Perez, “Political Participation of LGBT Americans,” published by Project Vote in 2014.
Exit poll data by election year in support of accompanying graphs:
Wendy Fenwick is an international writer based in Boston.


